Home / Blog / Audio Signal Proccessing
Audio Signal Proccessing

By EKbana on April 16, 2020
6m readAccording to Wikipedia, “Audio signal processing and Digital Signal Processing is a subfield of signal processing that is concerned with the electronic manipulation of audio signals.” Now for those who are totally new to Audio Signal Processing, might be wondering what is signal processing and audio signals?
Signal Processing
Again taking the definition from Wikipedia, “Signal processing is an electrical engineering subfield that focuses on analyzing, modifying, and synthesizing signals such as sound, images, and biological measurements.” In short, it turns signals into useful information.
Audio Signals
An audio signal is a representation of sound, typically using a level of electrical voltage for analog signals, and a series of binary numbers for digital signals. Audio signals have frequencies in the audio frequency range of roughly 20 to 20,000 Hz, which corresponds to the lower and upper limits of human hearing.[2] There are two types of Audio signals, Digital and Analog. Difference between them? In simple form explained by Michael Bauers: “Digital means that that the source of the audio is a string of numbers called samples. There’s a set number of samples per second. Each sample has what’s called a bit depth, which is simply the number of bits. For example, the digital audio could be something like 16-bit audio, at 44.1 kHz ( 44,100 samples per second.)” and “Analog generally implies that the source audio is analog. It’s a continuously varying signal. For example, a vinyl record is analog.” [10]
Digital Signal Processors (DSP)
Digital Signal Processors (DSP) take real-world signals like voice, audio, video, temperature, pressure, or position that have been digitized and then mathematically manipulate them. Signals need to be processed so that the information that they contain can be displayed, analyzed, or converted to another type of signal that may be of use.[8]

Now let’s jump into sound since audio signals are the representation of a sound!
Sound is a vibration that travels through the air or another medium and can be heard when they reach a person's ear. All vibrations, including sound, have a frequency.

To work with the sound, you should know about a wave

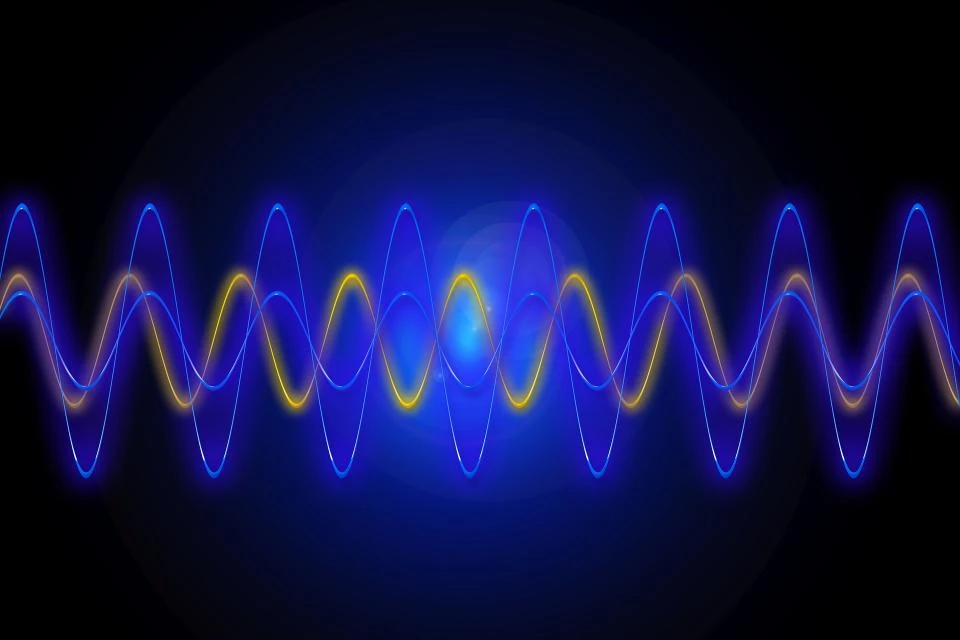
A wave is a movement in time in a medium. The energy is transferred due to this movement in the medium. In such a case, it is called a wave. For eg: Electromagnetic waves, light waves. While a signal is the one that carries information in the wave. the basic function of a sine wave is

where A is the amplitude, f is the Frequency, w is (2*pi*f), and phase is often used to shift the starting point of the waves.
In python, it can be written as
y = amplitude*np.sin( 2 * np.pi *frequency * t)
Plotting a simple sine wave by applying the sine wave function to understand a wave better.


As you can see, it has created one cycle withing the given audio length.
Amplitude

The amplitude of a wave refers to the maximum amount of displacement of a particle on the medium from its rest position. In a sense, the amplitude is the distance from rest to crest. Similarly, the amplitude can be measured from the rest position to the trough position. [9] (A crest is a point on a wave with the maximum value upward displacement within a cycle. A trough is a minimum or lowest point in a cycle. [Reffer to the Wave image for crest and trough])
Plotting a simple sine wave with different amplitude for comparison


as you can see that the crest and trough are 10, -10 respectively when the amplitude is given as 10 and similarly for Amplitude=20, crest and trough are 20,-20 respectively.
Frequency

Frequency is a measure of the number of wave crests that pass a fixed point per second. At higher frequencies, more wave crests will pass the point each second; for this to happen, the wavelengths must be short. As frequency decreases, fewer waves will pass the fixed point per second, so wavelengths will be relatively longer.
Plotting a simple sine wave with a different frequency to compare


As you can see that the number of frequencies that we give, it generates that number of cycles in the given length. Like when the frequency is 10, there are 10 cycles in the given time and similarly, when the frequency is 20, there are 20 cycles in one second timeline. To plot and listen to it, you can check out the notebook
Sampling Rate
In a Sound, the sampling rate (or sample frequency) is the number of samples per second. A sampling rate of 44,1 kHz (44.100 Hertz) means that the audio signal has been sampled with 44100 samples per second and if it's for 20 seconds, it will 44100 *20 = 882000 samples.

Plotting a simple sine wave with different sample rate to compare


Along with the various sample rate plotting, you can see that it generates the number of samples for one second. Like for sample rate = 40, there are 40 samples taken from the one-second audio.
We’re empowering
business growth for our clients.
Take the first step towards growth today.
Get Proposal
More From EKbana
 See All Blog


